Perioperative Analytics: Exploratory Data Analysis in the OR (Part 4 of 4)

I am now entering the final phase of this blog series, in which I am delving into the analytics of knee replacements at one hospital. You can access the first three posts in this series here: part 1, part 2, part 3.
The Seven Bridges of Königsberg to the Rescue
Leonard Euler’s 1736 paper on what is considered to be Graph Theory, may be able to shed further light onto many 21st century problems, including that of preference cards.
If we can determine the relationship between surgical products and their preferences by various physicians, could that bring into focus a perspective that has not been seen before?
To simplify the idea, here is a relatively crude visualization of a small number of orthopedic surgeons and the surgical products they used in performing total knee replacement procedures.

Could you spot which red dots are the surgeons and which are the products? It should not be very difficult. Could you also tell which products are shared among the surgeons represented here versus just a few? That too, should not be very difficult.
Could you also tell if Dr. Smith is in this network diagram? That could be a bit trickier. You can try to eyeball it, but you might end up with an eye strain trying to count small red dots!
Fireworks?
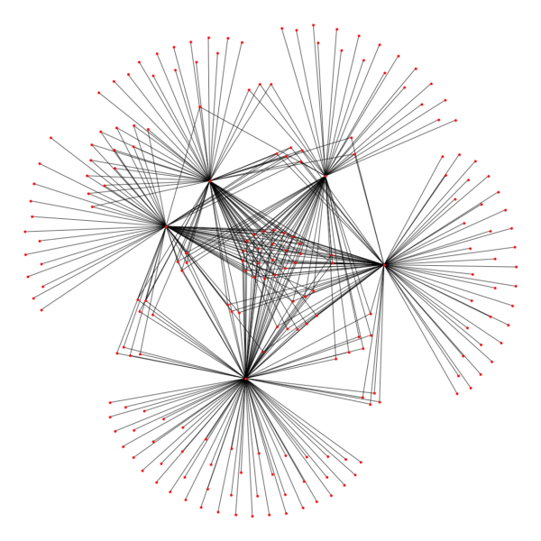
To help out with the answer, here is a more ‘embellished’ version of the same diagram rendered through a specialized graph visualization tool but this time with all the orthopedic physicians represented in it (not just a few).
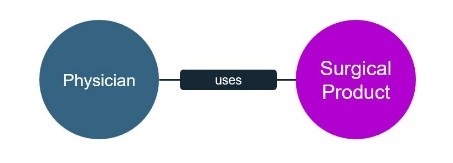
The above diagram is what is known as a bi-partite graph based on a very simple graph relationship.

The point of this diagram is very simply that the more products in the middle that are shared by all physicians, the better it is for the hospital support staff. They do not need to deal with “the more surgeons, the more product variety, the more overhead, cost, and labor” problem.
From what you have read about Dr. Smith so far in this blog, could you now tell which circle represents him? I bet you can and without any eye strain either.
Preference Card Evolution, Perhaps?
Moreover, when looking at the chronologically ordered list of procedures and the respective product usage for Dr. Smith, I clearly see that some products have been added later in time, sporadically at first and consistently thereafter. I have also seen the exact reverse, with some products removed. Are these changes signaling indications of preference card evolution or just ad hoc requests made in the midst of the surgical procedure? I cannot say yet. However, a more interesting set of questions starts percolating in my mind.

Could this be a mechanism to track and later compare preference card evolution of knee replacement procedures? Can it be done not just for Dr. Smith, but for all surgeons?
Veering Toward Predictability
Armed with historical product usage data, could it be possible to devise a scheme that suggests qualitative and then quantitative adjustments to preference card make-up, not only to minimize labor overhead, but also more importantly to significantly reduce patient infection risk?
Also, in dealing with mid-procedure ad hoc product requests (the ones that are not on preference cards), could the stage be set to help take corrective actions, by predicting the demand for these products and making them available upfront, thus minimizing procedure disruption?
Does Preference Card Standardization Make Any Sense?
Could product variability for performing the same procedure be reduced with surgical staff buy-in, so that hospitals not only would deal with the OR logistics more efficiently and eliminate product expiration, but also have more bargaining power with vendors to get better deals?
Does it make sense to have a standardized procedure-specific preference card for the hospital? Could this standard be industry-wide? Am I pushing my questioning luck too far? Coming from a purely analytical and healthcare layman’s perspective, maybe sometimes it does make sense to ask bold questions that might seem absurd to most at first but could challenge the thought processes of “we have always done it this way…” into valuable what-if scenarios.
Conclusion. The Questions Remain!
The initial foray into perioperative exploratory data analysis has now concluded. The descriptive part of my analytical endeavor has revealed that a major orthopedic hospital was conducting a sizable operation, where hundreds of orthopedic surgeons were conducting thousands of surgeries and using hundreds of thousands of products—all within a very short span of time. Narrowing the scope on one particular high-rate, single-surgeon/single-procedure intervention (total knee replacement), I discovered some sobering statistics worthy of further diagnostic scrutiny:
- Why is it that roughly 30-35% of the requested products are being returned unused at a considerable cost?
- Why is a non-negligible number of unrequested products being returned?
- Why are some of the products consistently being returned unused?
- Why do some surgeons use more than 75% more products than their peers?
- Why is there so much product variability for identical procedures?
The nature of the above questions has in turn undoubtedly led me to ponder some rhetorical what-if questions myself:
- Can mid-procedure impromptu product requests be predicted?
- It is useful to track the evolution of preference cards?
- Does it make sense to have unified/standardized preference cards?
- Would the product storage footprint be reduced by a significant percentage?
- Could there be better synergy between the clinical and supply chain sides of healthcare, so that they are clinically driven, yet cost-aware?
In the process of finding some answers to the above questions, my hope is to come across interesting analytical possibilities that will lead to potential business insight that has the healthcare profession’s backing. Or if not, at least it might arouse their curiosity to think of yet-unconsidered what-if possibilities. After all, exploratory data analysis is meant to be just that: the opportunity to explore with the hope of discovery! And it’s the hope that this discovery will make all of us start thinking out of the box. Discoveries will lead us to actionable business insights to improve perioperative business processes, by predicting what will happen and prescribing how to promote or prevent certain eventualities.
In leveraging descriptive and diagnostic analytics in the current leg of my Exploratory Data Analysis journey, I have come out of this analytical endeavor acutely aware on one hand and better informed on the other, of the many challenges of the perioperative scene.
By using state-of-the-art technology, whether it is advanced visualizations to better assess perioperative business processes, or machine learning technology to learn and make sense of the data and propose actionable business insight, I feel confident that I have set the stage to extend further the next leg of my analytical journey into the predictive and prescriptive zones.
I hope that you, the reader, will still accompany me, as you already have, through other series of blogs that I intend to write.


